 Quick View
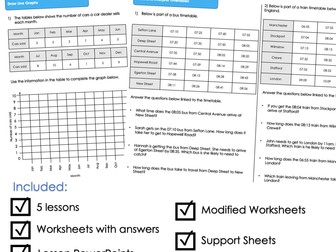
Year 5 Statistics - Read and Interpret Timetables Lesson
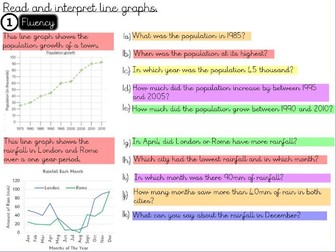
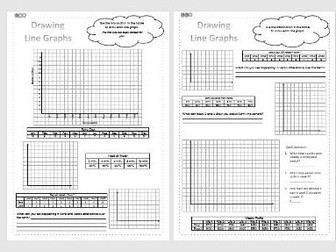
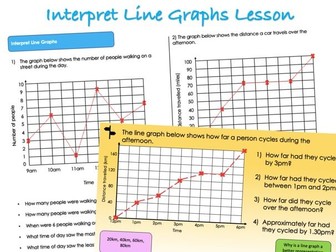
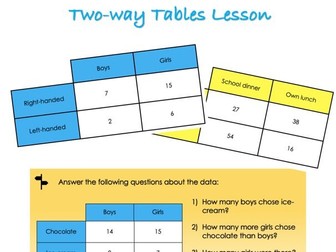
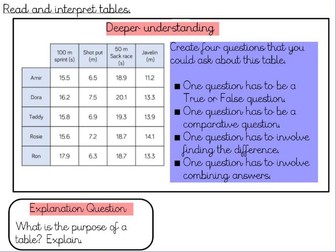
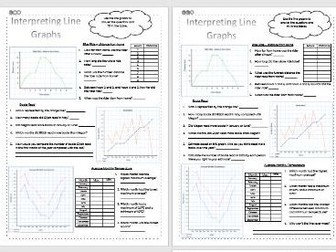
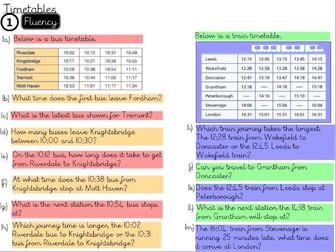
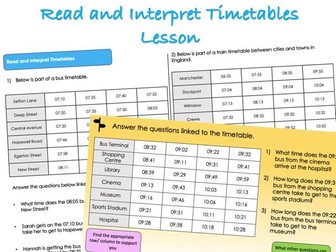
<p>A fully resourced statistics lesson for being able to read and interpret data from timetables (including bus and train timetables and a timetable for studying) in Year 5 based on the objective from White Rose Maths.</p>
<p>Included in the resource is:</p>
<ul>
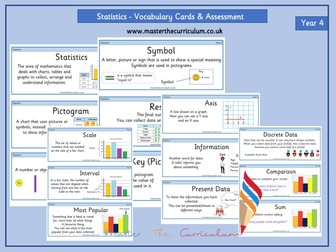
<li>A lesson PowerPoint with starter, vocabulary, modelling (with teacher notes) and guided practice</li>
<li>Lesson plan</li>
<li>Worksheet with answer sheet</li>
<li>Scaffolded worksheet with answer sheet</li>
<li>Modified worksheet for those who need additional changes to access the learning with answers</li>
<li>Challenge tasks</li>
<li>Support strips that can be stuck in books</li>
</ul>
<p>Everything is included that could be needed to run the lesson successfully, with each resource carefully considered in ensuring accessibility for all as well as ensuring there are plenty of opportunities for challenge to provide depth of understanding.</p>